Avoid these bad coding habits.

Hello Everyone!

When it comes to coding, most people think it is something mystical that only geeks can understand. Believe me, it is not like that my friend. Anyone can code with a fair amount of practice.

There is nothing mystical about it.

Coding is a skill like any other. Like language learning, there’s grammar and vocabulary to acquire. Like math, there are processes to work through specific types of problems. Like all kinds of craftsmanship and art-making, there are techniques and tools and best practices that people have developed over time, specialized to different tasks, that you’re free to use or modify or discard.

Here we are about to see a few bad coding habits that you must avoid.

Avoid these bad coding practices:

1. Saying “I’ll fix it later”.

The habit of postponing code fixes is not merely a problem of priorities. Organizing your issue tracker might generate some progress, but you also need to have a way of tracking smaller issues that come up. Adding “TODO” comments is a quick way of making sure you don’t miss anything.

2. Insisting on a one-liner solution

Being obsessive about writing efficient, elegant pieces of code is a common trait of programmers. It’s like solving a puzzle—you find a combination of functions and regular expressions that turn 20 code lines into 2 or 3. Unfortunately, it doesn’t always result in readable code, and that’s generally the far more important outcome. Make your code accessible first, then clever.

3. Difficulty seeing through recursion

The idea of recursion is easy enough to understand, but programmers often have problems imagining the result of a recursive operation in their minds, or how a complex result can be computed with a simple function. This makes it harder to design a recursive function because you have trouble picturing “where you are” when you come to writing the test for the base condition or the parameters for the recursive call.

4. your code is a mess

Symptoms
  1. Doesn’t follow a consistent naming convention.
  2. Doesn’t use indentation, or uses inconsistent indentation.
  3. Doesn’t make use of whitespace elsewhere, such as between methods (or expressions).
  4. Large chunks of code are left commented-out.
Programmers in a hurry commit all these crimes and come back to clean it up later, but a bad programmer is just sloppy. Sometimes it helps to use an IDE that can fix indentation and whitespace with a shortcut key, but there are programmers who can even bludgeon Visual Studio’s insistence on proper indentation by messing around with the code too much.

5.Reinventing the wheel all the time

Don’t write code you don’t need to. Perhaps someone else has spent a good deal of time on your problem already, and he or she might have a well-tested solution that you can reuse. Save yourself some trouble.
Conclusion.

As the old saying goes, “If it walks like a duck and quacks like a duck, it’s probably a duck.” The same is true for bad code. If it looks like bad code and smells like bad code, it’s probably bad code. The infallible developer does not exist. The almighty developers that came before may have made a mistake, and you will too. It is how coding works.
So, this is it for this article. We will surely talk about good coding habits and practices in upcoming articles.
Thank You.

JavaScript debugging dev tools.

Errors can and will happen every time you write some new computer code.

Programming code might contain syntax errors or logical errors. Many of these errors are difficult to diagnose.

Often, when programming code contains errors, nothing will happen. There are no error messages, and you will get no indications where to search for errors.

Searching for (and fixing) errors in programming code is called code debugging. And believe me, that’s not easy but the most valuable skill a developer could have.

Hence, here I am with top JavaScript debugging tools.

Chrome DevTools:

chrome dev tools

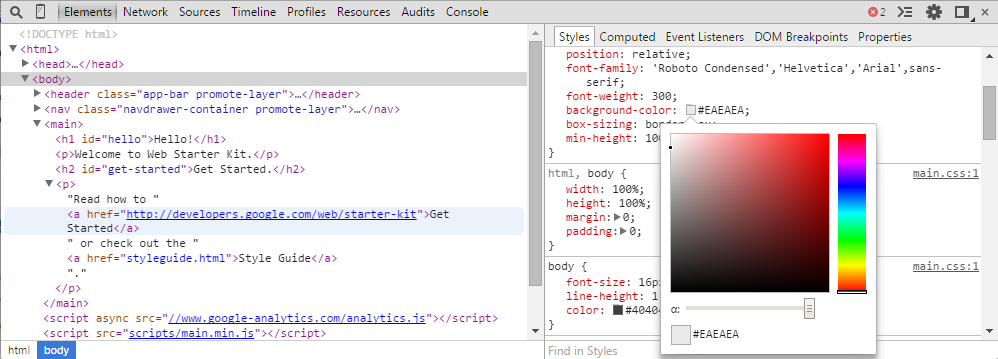
Google Chrome DevTools is a set of debugging tools that can be used to debug JavaScript code right from the Chrome browser as they are inbuilt. You can get to interact with HTML, CSS and JavaScript all from the browser simply by clicking the inspect element button.

It has the resources panel for inspecting the storage of web pages such as the HTML5 database, cookies, local storage etc.

You may have been using Chrome all these years without knowing that it has a debugging tool with so much power.

Sublime Web Inspector:

SublimewebinspectorThe sublime web inspector is a javascript debugging tools. The sublime web inspector allows you to debug, whatever you edit in your programs. It works on top of Web Inspector Protocol.

If you use Sublime Text Editor for your JavaScript editing, then Sublime Web Inspector allows you to debug from the same program you edit with. It works on top of WebInspectorProtocol, with all information displayed in console and text files.

Node.js Inspector for Debugging Requests to Node Apps

Debugging the Node.js on your application’s backend can be challenging. The following tools take advantage of the capabilities of the Node.js Inspector to assist you:


React Developer Tools

IN THE BROWSER: The React tab shows props and state values if they exist for the selected elements.So, these were the four debugger tools that can make debugging easier for you. You can learn to use them through the tutorials available online for free. Hope you liked the article.

Thank You.

Plunker and Angular JS.

Hi Everyone!

Let’s talk about Plunker, what is it and how is it related to Angular JS.

Plunker is an online community for creating, collaborating on and sharing your web development ideas. Plunker is the best tool to prototype, experiment, share and debug your ideas on the web platform. From idea to implementation, Plunker helps you build the web.

This is what they say in technical terms, let me clarify this.

Plunker:

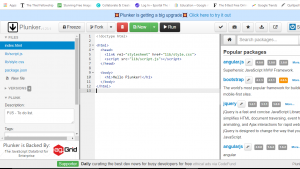
Plunker or plnkr is an integrated web development environment and is completely written in AngularJS. The plunker website also provides you to write plunks(codes) and share it with other developers.

There is also the ability to search for popular JavaScript library and refer it to your current plunk. Another feature is the live preview which is quite handy when you are learning AngularJS as you can see the result of your code change in real-time.

Some of the other features are the ability to do real-time collaboration on Plunker and I recommend that if you are going to do any serious AngularJS development then try Plunker first.

A really handy feature is that you can use almost any framework right from the editor, without any complex setup.

We can code up Angular in the browser using plunker. It gives us the ability to try our Angular quickly without requiring complex setup.

It also gives us a unique URL so:

  1. We can quickly take a look at some code another person has written.
  2. We can share our code with other people, which is especially useful when we are stuck with some broken code and need help.

Why do most Angular JS people prefer Plunker?

The material reason is that Plunker allows creating an arbitrary number of files, while JSFiddle (or JSBin, for that matter) restrict you to one HTML + one CSS + one JS. Plunker also allows downloading the project as a ZIP.

Plunker allows you to describe a larger example of functional Angular.js code than JSFiddle.  It also gives better feedback and real-time previews as you type.

JSFiddle, on the other hand, allows you to quickly share a single example of some functional code, mainly a jQuery snippet of some sort.

Both are great platforms and have contributed so much to the community.

So, I hope that you liked this post and got some useful information. Stay tuned for more such contents.

Thank You.