Errors can and will happen every time you write some new computer code.
Programming code might contain syntax errors or logical errors. Many of these errors are difficult to diagnose.
Often, when programming code contains errors, nothing will happen. There are no error messages, and you will get no indications where to search for errors.
Searching for (and fixing) errors in programming code is called code debugging. And believe me, that’s not easy but the most valuable skill a developer could have.
Hence, here I am with top JavaScript debugging tools.
Chrome DevTools:
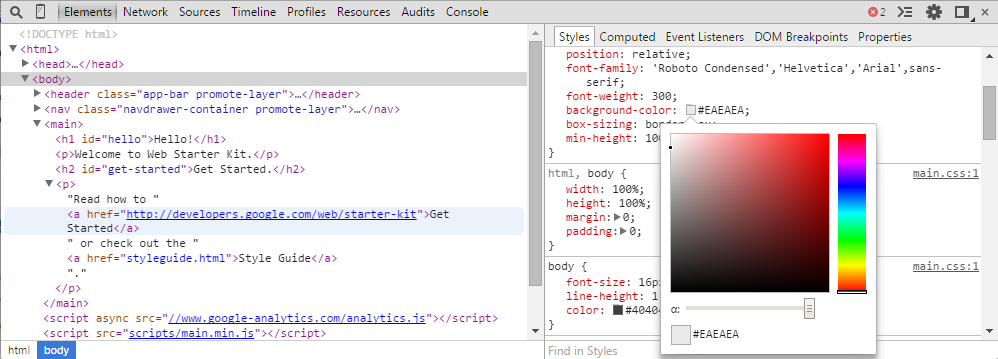
Google Chrome DevTools is a set of debugging tools that can be used to debug JavaScript code right from the Chrome browser as they are inbuilt. You can get to interact with HTML, CSS and JavaScript all from the browser simply by clicking the inspect element button.
It has the resources panel for inspecting the storage of web pages such as the HTML5 database, cookies, local storage etc.
You may have been using Chrome all these years without knowing that it has a debugging tool with so much power.
Sublime Web Inspector:
 The sublime web inspector is a javascript debugging tools. The sublime web inspector allows you to debug, whatever you edit in your programs. It works on top of Web Inspector Protocol.
If you use Sublime Text Editor for your JavaScript editing, then Sublime Web Inspector allows you to debug from the same program you edit with. It works on top of WebInspectorProtocol, with all information displayed in console and text files.
React Developer Tools
Thank You.


Leave a Reply